


1
2
3
4
5
6
7
8
9
10
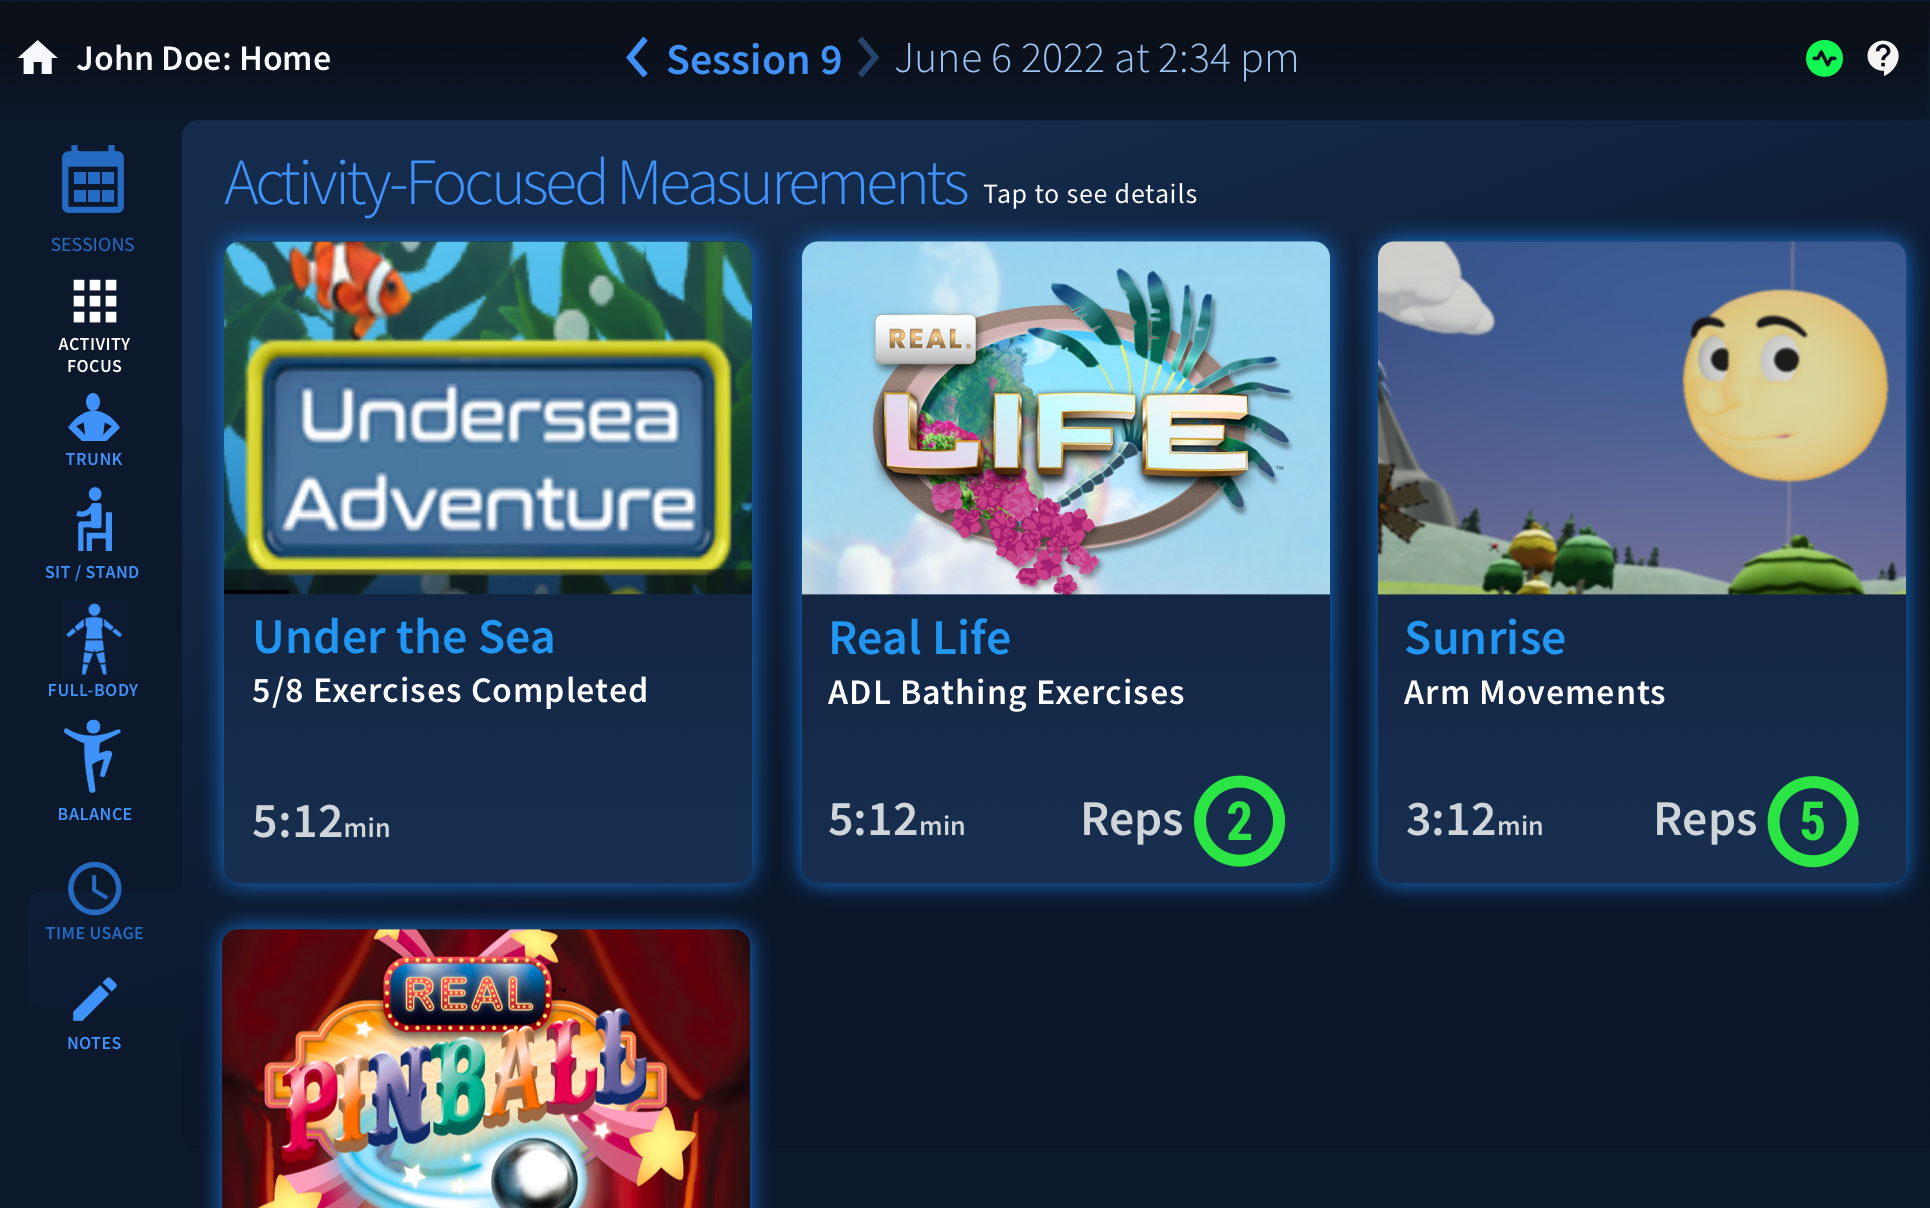
Session Activity-based Metrics
Activities will have game-specific results which previously had not been tracked (scores as example). This screen reflects a session's playlist and any specific results data.
Exercise Results
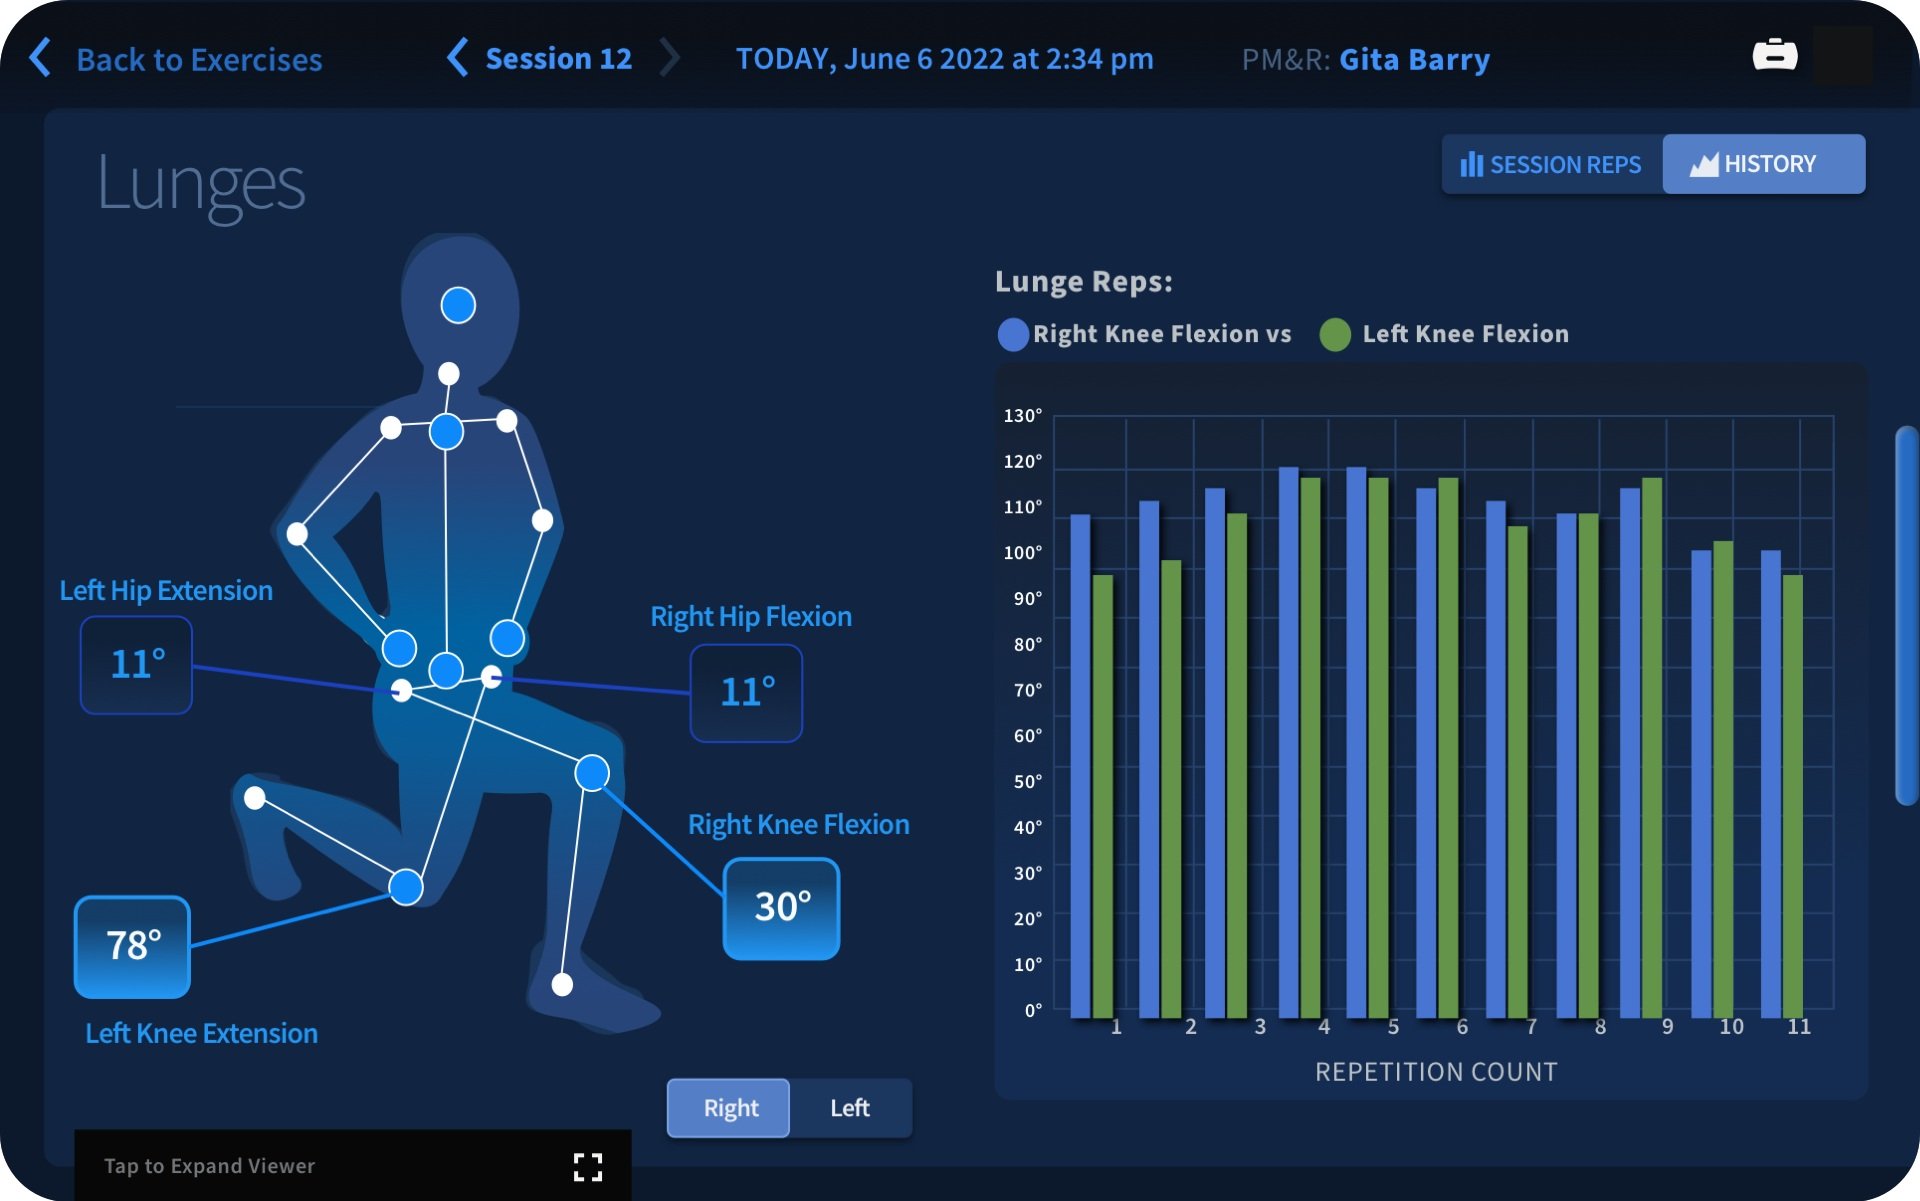
Instead of generalized game metrics, for specific movements and exercises the therapist is able to select an exercise and review results across all activities that contain that exercise.
Exercise ROM Data
Individual exercises will have a variety of muscle group measurements. Primary and secondary ROM values can show a clinician if the patient is using compensatory muscles or movements to hide impairments. Each image is a programmed SVG with dynamic data inputs from the REAL Cloud.
Longitudinal Data over Sessions
Increases in ROM and mobility can be displayed on any session value link. Proving efficacy over time is important to clinics to prove value of therapy and access to continued billing.
Trunk Sway and Lean Data
Anterior and posterior lean data is a primary source of patient improvement data. Sensors coordinate with the headset and upload raw data to REAL Cloud Services. Using customized eCharts we can display the improvements in maximum lean control forward and sideways when in game play.
Sitting and Standing Measures
In 2022 REAL added full-body, standing ability to their sensor configurations. This enables more endurance-based activities to be converted to a standing position. Part of rehab progress is a patients endurance which can be measured(as a proxy) with sitting vs. standing ratio. Tracking this over time or over the session can display fatigue points.
More Longitudinal Data
These charts show thoracic and lumbar improvements over a period of time. Again, this assists clinicians in proving efficacy of therapy and proving to insurance that therapy has billing value for the patient.
Trunk Excursion Overhead Charting
Showing bias over the direct center of mass plus lean max angles. Heatmapping can show tendencies and areas of neglect which the therapist can focus on using difficulty settings.
Trunk Measures in Degrees
Areas of neglect or weaknesses can be measured in absolute degrees using sensor data which is packaged and sent to the REAL Cloud Services by the Vive Headset.
Activity Metrics and Impairments Focus
Longitudinal data shows session duration over time(endurance measurement), sit and stand ratio, sensor configurations in the session. Relative time spent in impairment focused categories also is a valued metric-therapists may need to adjust for the future sessions.